
OSGJS is a WebGL framework based on OpenSceneGraph concepts. It allows an individual to use an “OpenSceneGraph-like” toolbox to interact with WebGL via JavaScript, and provides facilities for exporting various assets to the osgjs format. The API is kept as similar to OpenSceneGraph as possible, providing a familiar environment to veterans of the library and introducing newcomers to a popular and heavily-scrutinzed set of interfaces.
Best jQuery Chart & Graph Plugins & Tutorials with Demo
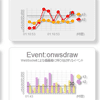
Chartist.js : Simple Responsive Charts
Chartist.js is a simple responsive charting library built with SVG. There are hundreds of nice charting libraries already out there, but they are either:
- not responsive
- use the wrong technologies for illustration (canvas)
- are not flexible enough while keeping the configuration simple
- are not friendly to your own code
- are not friendly to designers
- have unnecessary dependencies to monolithic libraries
- more annoying things
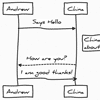

SimpleFlowchart : SVG flow chart library with jQuery

Simple SVG flow chart library based on jQuery and jQueryUI.
This is a small JavaScript library with single purpose – draw some nodes and connect them with lines. You can use this library to create your own flow charts or create other similar graphics. Nodes and connection lines can be styled with CSS. Node content can be whatever you want – simple div, image or SVG.
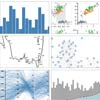
PivotTable.js : JavaScript Pivot Table, Chart, Grid Library

PivotTable.js is a Javascript Pivot Table library with drag’n’drop functionality built on top of jQuery/jQueryUI and originally written in CoffeeScript by Nicolas Kruchten at Datacratic.
PivotTable.js’ basic function is to turn a data set into a summary table and then optionally add a true 2-d drag’n’drop UI to allow a user to manipulate this summary table, turning it into a pivot table, very similar to the one found in older versions of Microsoft Excel with a bunch of extra developer-oriented features and some visualization effects. With optional add-ons, the summary table can be rendered various kinds of charts, turning the pivot table into a pivot chart.


