A pie chart (or a circle chart) is a circular statistical graphic, which is divided into slices to illustrate numerical proportion.It is generally used in business world when you have to display comparison or difference of some data in a graphical manner. So in this tutorial we will show you how to display data in pie chart using PHP, jQuery and Google API.
Best jQuery Chart & Graph Plugins & Tutorials with Demo
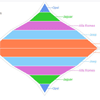
Graphart : JavaScript Graphs and Charts

Graphart is HTML5/JavaScript charting library based on the Canvas, which allows you to create rich charts that are completely responsive and work in all browsers. Nowadays, data visualization and analysis is now an key factor of business processes. That makes it all the more important to choose the right kind of JavaScript Charting library that best matches your needs.

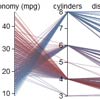
MetricsGraphics.js : JavaScript Data Graphics and Layouts Library
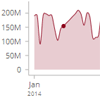
MetricsGraphics.js is a library built on top of D3 that is optimized for visualizing and laying out time-series data. It provides a simple way to produce common types of graphics in a principled, consistent and responsive way. The library currently supports line charts, scatterplots, histograms, bar charts and data tables as well as features like rug plots and basic linear regression.
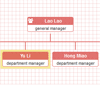
jQuery FlowChart Plugin

jQuery flowchart.js is an open source jquery ui plugin that allows you to draw and edit a flow chart.
- Draw boxes (called operators) and connections between them.
- Methods are provided so that the end-user can edit the flow chart by adding / moving / removing operators, creating / removing connections between them.
- The developper can save / load the flowchart.
- Operators and links can be customized using CSS and the plugin parameters.
- Some methods allow you to add advanced functionalities, such as a panzoom view or adding operators using drag and drop.
FusionCharts : jQuery Charts Plugin

jQuery plugin for adding interactive charts and graphs to your website.Full functionality of FusionCharts can be accessed through it – charts, events, methods etc.
You will have access to all the rich features of FusionCharts like events, macros, zooming, panning, annotations, image-exporting etc.