Best jQuery Chart & Graph Plugins & Tutorials with Demo

    js2flowchart.js : Beautiful SVG Flowchart Library

    js2flowchart.js : Beautiful SVG Flowchart Library

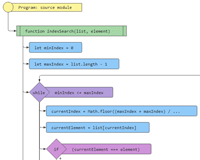
    js2flowchart – a visualization library to convert any JavaScript code into beautiful SVG flowchart. Imagine a library which takes any JS code and generate SVG flowchart from it, works on client and server. Allows you easily adjust styles scheme for your context or demonstrate your code logic from different abstractions levels. Highlighting, destructing whole blocks, custom modifiers for your needs etc.


    ECharts : Interactive Charting & Visualization Library

    ECharts : Interactive Charting & Visualization Library

    ECharts is a free, powerful charting and visualization library offering an easy way of adding intuitive, interactive, and highly customizable charts to your commercial products. It is written in pure JavaScript and based on zrender, which is a whole new lightweight canvas library.

    KoolChart : HTML5 CANVAS based Charting Solution

    KoolChart : HTML5 CANVAS based Charting Solution

    HTML5 CANVAS-based charting solution with excellent performance Works on all HTML5-supported browsers With a single development effort, the chart layout and style can be used on multiple devices.

    • 30 essential chart types, which is the most numerous provided in a single package.
    • Brilliant 2D and 3D charts with animation effects.
    • 400 ready-to-use sample charts are pre-packaged by default.
    • Customize styles, themes, tooltips, axes, labels, user-defined JavaScript functions, etc.
    • Simulate charts with Data Editor.

    IVIS : jQuery Chart editor for Interactive Visualisation

    IVIS : jQuery Chart editor for Interactive Visualisation

    IVIS is a chart editor for interactive visualisation, based on jQuery and HighCharts. Chart types include dot/scatter, 2D scatter, line, bar/column, pie, and heat map. It’s powerful when analysing large data sets.

    • Dot / Scatter plot: X as names and Y holding one or more values
    • 2D Scatter (XY Plot) using X-Y paird values, such as volcano plot, MA plot, 2D PCA, correlation chart, standard curve and so on
    • Bar / Column chart: can use grouped data
    • Line chart: multiple series can be plotted
    • Pie chart: in 2D or 3D
    • Heatmap fast overview of many data points

    Billboard.js : JavaScript Chart library with D3

    Billboard.js : JavaScript Chart library with D3

    billboard.js is a re-usable easy interface JavaScript chart library, based on D3 v4+.

    circleChart : jQuery plugin for Drawing Circular Charts

    circleChart : jQuery plugin for Drawing Circular Charts

    CircleChart is a small jQuery plugin is useful for creating simple pie charts.

    amCharts Data Loader with JSON or CSV Files

    amCharts Data Loader with JSON or CSV Files

    By default all amCharts libraries accept data in JSON format. It needs to be there when the web page loads, defined in-line or loaded via custom code.

    This plugin introduces are native wrapper that enables automatic loading of data from external data data sources in CSV and JSON formats.

    Demo 1 Demo 2 Demo 3

    Cesium : WebGL based JavaScript library for 3D globes and 2D maps

    Cesium : WebGL based JavaScript library for 3D globes and 2D maps

    WebGL based JavaScript library for creating high-resolution 3D globes and 2D maps. It supports different map providers, weather simulations, and a ton of other complex features. Their Demos page has a big collection of community projects showcasing what Cesium is capable of, including a 3D map of all the building in New York and projects by NASA.

    Recharts : Charts library built with React and D3

    Recharts : Charts library built with React and D3

    Charts library built on top of React and D3. Graphs can be created via a simple XML-like syntax, with many of the important options set directly as attributes. The library also offers a rich examples catalog with more than 50 ready-to-use components, including various Line, Bar, Pie and other types of charts.

    IguanaCharts : HTML5 jQuery Stock Charts library

    IguanaCharts : HTML5 jQuery Stock Charts library

    IguanaCharts is HTML5 jQuery Stock Charts library.You can download our open source library and setup powerful stock chart just in minutes.

    Features:

    • Zoom and load chart history with mouse wheel
    • Draw on chart trend lines, fibonacci, corners and plenty other figures
    • Use technical analysis indicators
    • Show trades on chart and trade from the chart